Introduction
Current guidelines suggest a fixed-rate insulin infusion (FRII) for the treatment of diabetic ketoacidosis (DKA), with concurrent dextrose-containing fluids added when blood glucose (BG) falls below 250 mg/dL to prevent hypoglycemia until resolution of ketosis.1–3 The optimal insulin and dextrose management strategy in DKA is unestablished, however, and hospitals increasingly utilize variable-rate insulin infusions (VRIIs) that leverage titration algorithms embedded into the electronic medication administration record (eMAR).4–10
While the use of eMAR insulin infusion calculators may improve medication safety through reduced user transcription errors and streamlined workflows for hospital staff, the efficacy and safety of this strategy has varied across published reports, with hypoglycemia rates ranging from <1% to 10-17% of patients.5–8,10–13 Validations of eMAR calculators for variable-rate insulin infusions in DKA remain especially limited.7–10 Furthermore, the optimal rate of coadministered dextrose-containing fluid to prevent hypoglycemia with variable-rate insulin strategies is unestablished.1,8,10
Our large community health system implemented eMAR calculators for all insulin infusion protocols in 2015 during computerized prescriber order entry system go-live. This report summarizes our internal appraisal of protocol adherence and associated clinical outcomes for our institutional eMAR calculator-based DKA protocol in patients with type 1 diabetes. Additionally, we explored the effect of various dextrose coadministration rates on clinical outcomes during treatment with the institutional DKA protocol.
Methods
Study Design and Setting
This retrospective, single-center cohort study and case series encompassed research reviewed by the OhioHealth Institutional Review Board (approval number 1946808) and quality improvement (QI) reviewed by the Office of Human Subjects Protections as a QI determination (submission number 1996696). Our institution is an urban, tertiary care, community teaching hospital and Level 1 Trauma Center with 640 licensed beds.
The institutional DKA protocol utilizes a variable-rate insulin infusion (VRII) that is titrated hourly by nursing staff via an eMAR calculator embedded in our electronic health record (EHR) (Epic®, Epic Systems Corporation, Verona, WI). The eMAR calculator uses an algorithm that considers the patient’s change in BG relative to the prior insulin infusion rate to derive a patient-specific insulin sensitivity factor (ISF) with each dose adjustment (Supplemental Figure 1), with the goal of tailoring insulin exposure to patient response and thereby minimizing the risk of hypoglycemia. Nursing staff may enter any source of BG level (ie, serum versus point-of-care) into the eMAR calculator for insulin infusion titrations, though policy dictates that point-of-care glucometer readings should be used unless the present BG value exceeds the device assay limits. Glucose readings are to be collected hourly unless hypoglycemia is detected, in which case the eMAR calculator instructs the nurse to increase frequency to every 15-30 mins until resolution per the institutional hypoglycemic management protocol.
When BG falls below 250 mg/dL, the institutional eMAR calculator prompts the nurse to switch the initial crystalloid infusion to a dextrose-containing maintenance fluid (MIVF) of co-formulated 5% dextrose/0.45% NaCl, with or without potassium 20 mEq/L, based on the patient’s present serum potassium level. The dextrose rate chosen is at the provider’s discretion, with no guidance provided by the protocol. Concurrently, a separate embedded eMAR calculator instructs the nurse to administer additional potassium chloride via intermittent IV piggyback (IVPB) to maintain serum potassium levels above 4 mEq/L (Supplemental Figure 2).
Study Population
Adult patients who were admitted between 1/1/2015-7/31/2022 and received the institutional DKA protocol for at least 4 hours were included in the study if they met all of the following criteria: a past medical history including type 1 diabetes, an initial BG of ≥250 mg/dL, an investigator-calculated anion gap greater than 12 mEq/L, and a serum beta-hydroxybutyrate (BHB) greater than 3 mmol/L or ketones present on urinalysis. Patients were excluded if they had a positive alcohol level on admission or other suspicion for non-diabetic ketoacidosis states (eg, those with no history or evidence of diabetes, documentation of alcoholic and/or starvation ketoacidosis). A randomly selected subset of patients meeting the above study criteria were manually chart reviewed for the protocol adherence assessment, which adjudicated accuracy to all recommended elements of protocol ordering (i.e., prescriber compliance) and protocol execution (i.e., nursing compliance).
Outcomes
The primary effectiveness outcome assessed was the time to resolution of DKA while on the institutional protocol, defined as time from the start of dextrose-containing fluid to all of: 1) BG level of ≤250 mg/dL, 2) Serum bicarbonate level of ≥15 mEq/L, and 3) investigator-calculated anion gap of ≤12 mEq/L (or a lab-reported anion gap of ≤20 if the first two criteria are met and patient is discharged before the calculated anion gap was ≤12). This extended inclusion criterion was chosen due to our institutional EHR reporting a normal anion gap reference range of 10 to 20 mmol/L. Patients who were transitioned off protocol prior to meeting the primary endpoint were not evaluable and therefore excluded from the primary outcome analysis only.
We assessed the primary effectiveness outcome descriptively in the full population and also in cohort analyses comparing patients who received different dextrose-containing fluid rates, with the aim of providing further insight as to how effectively the protocol is resolving DKA under different user-specified configurations. We chose to start the assessment of the primary outcome at the time of dextrose infusion initiation, rather than insulin infusion initiation, in order to apply a consistent “time zero” to all cases that was independent of the degree of hyperglycemia at protocol initiation. This also allowed for exploration of the dextrose rate’s impact on DKA resolution and other clinical outcomes. Accordingly, effectiveness and safety outcomes were compared between patients with dextrose-containing fluid rates of <1 mL/kg/hr vs. ≥1 mL/kg/hr, and also between those with dextrose-containing fluid rates of 50 mL/hr, 75 mL/hr, 100 mL/hr and 125 mL/hr. These four rates correspond to the currently-orderable options embedded in the institutional order set, while the weight-based rates represent a patient-specific transposition of these to provide additional context for comparison.
Secondary effectiveness outcomes included the incidence of the insulin drip rate dropping below 0.05 units/kg/hr post dextrose 5% infusion initiation, the incidence of patients transitioned off DKA protocol prior to meeting the primary outcome, and the incidence of increase or decrease in dextrose infusion rate from the initially-ordered rate. Safety outcomes included the incidences of hypoglycemia (any BG of <70 mg/dL, <54 mg/dL, and <40 mg/dL, so as to align with currently recommended hypoglycemia reporting thresholds),14 hypokalemia (any serum potassium level of <3.3 mEq/L), hypophosphatemia (any serum phosphate level of ≤2 mg/dL), and severe hypophosphatemia (any serum phosphate level of ≤1 mg/dL), occurring at any point during intravenous insulin infusion therapy. We also assessed the incidence of patients with any BG decrease of >100 mg/dL/hr and those with insulin infusion rates exceeding 0.1 units/kg/hr in the total study population.
In the protocol adherence assessment, correct prescriber ordering and correct nursing execution of all protocol elements were adjudicated at each decision point for a particular patient. For prescriber compliance, we assessed utilization of the institutional DKA protocol order set by both emergency department and admitting prescriber, appropriateness of initial IV fluid selection (based on corrected serum sodium and initial serum potassium levels as instructed in the order set), and completeness of laboratory orders (BMP at baseline and every four hours, BHB at baseline and every 4 hours, phosphorus at baseline and every 4 hours, and venous blood gases at baseline). For nursing compliance, we assessed administration of the appropriate MIVF based on current BG and serum potassium levels, rate of starting dextrose-containing fluid within 60 mins of first BG <250 mg/dL, rates of appropriate potassium chloride IVPB administration per the eMAR calculator, and the accuracy of every hourly VRII titration as instructed by the eMAR calculator.
Statistical Analysis
All statistical analyses were completed using Microsoft® Excel® (v2505 Build 16.0.18827.20102) and JASP (v0.18.1.0). Descriptive statistics were calculated for all variables, including counts and percentages for categorical variables and either means with standard deviations or medians with interquartile ranges for continuous variables as appropriate based on data distribution. Categorical variables were compared utilizing chi-squared tests, and continuous variables were compared utilizing independent samples T-tests. Based on an a priori power analysis, setting alpha at 0.05, a sample size of 196 would provide at least 95% power to detect a 30% difference in time to DKA resolution in the four-group comparison (thereby ensuring meaningful analyses in both the 2-group and 4-group comparisons). Data were collected from our EHR via electronic variable reporting and manual chart review, starting with the most recent timeframe and working backwards until the powered sample size was met.
Results
Patient Population and Baseline Characteristics
Between January 1, 2016 and July 31, 2022, a total of 413 patients with type 1 diabetes mellitus were initiated on our hospital’s DKA protocol, of whom 175 were evaluated for primary outcomes while 196 were evaluated for secondary outcomes (Supplemental Figure 3). Twenty-one patients were excluded from the primary outcome analysis due to being transitioned off the DKA protocol prior to meeting the primary outcome criteria for resolution of DKA and so were not evaluable. Demographic characteristics were largely similar between groups (Supplementary Tables 1 and 2). Patient weight was significantly higher in the <1 mL/kg/hr vs. ≥1 mL/kg/hr dextrose rate group (median 80.54 kg, IQR 71.25-106.50 vs. 67.50 kg, IQR 57.90-79.40, p<0.001).
Effectiveness and Safety Outcomes
There was no significant difference in the primary effectiveness outcome of time to DKA resolution between the various dextrose-containing MIVF rates (Table 1 and Supplemental Table 3). The incidence of patients being transitioned off the DKA protocol prior to DKA resolution was significantly higher in the <1 mL/kg/hr dextrose rate group than in the ≥1 mL/kg/hr group (20% vs 7.5%, p=0.014), as were increases in dextrose-containing MIVF rate from initial rate (26% vs 9.6%, p=0.004). Patients transitioned off the institutional DKA protocol prior to meeting the primary outcome ultimately required reinitiation of the protocol (n=3), saw significantly uncontrolled BG without reinitiating DKA protocol (n=15), or left the hospital against medical advice (n=3). Hypoglycemia and significant electrolyte abnormalities were frequent and not significantly different between groups (Table 1, Supplementary Table 3).
In the total study population, the weight-based VRII rate dictated by the eMAR calculator ranged from 0.08 to 0.82 units/kg/hr, with an average maximum insulin rate of 0.16 units/kg/hr (standard deviation 0.10 unit/kg/hr). Forty patients (20.4%) were administered VRII rates of ≥0.2 units/kg/hr during DKA protocol, with fifteen patients (7.7%) seeing rates of ≥0.3 units/kg/hr, nine (5.0%) with rates of ≥0.4 units/kg/hr, and 6 (3.1%) with rates of ≥0.5 units/kg/hr during treatment.
Protocol Adherence
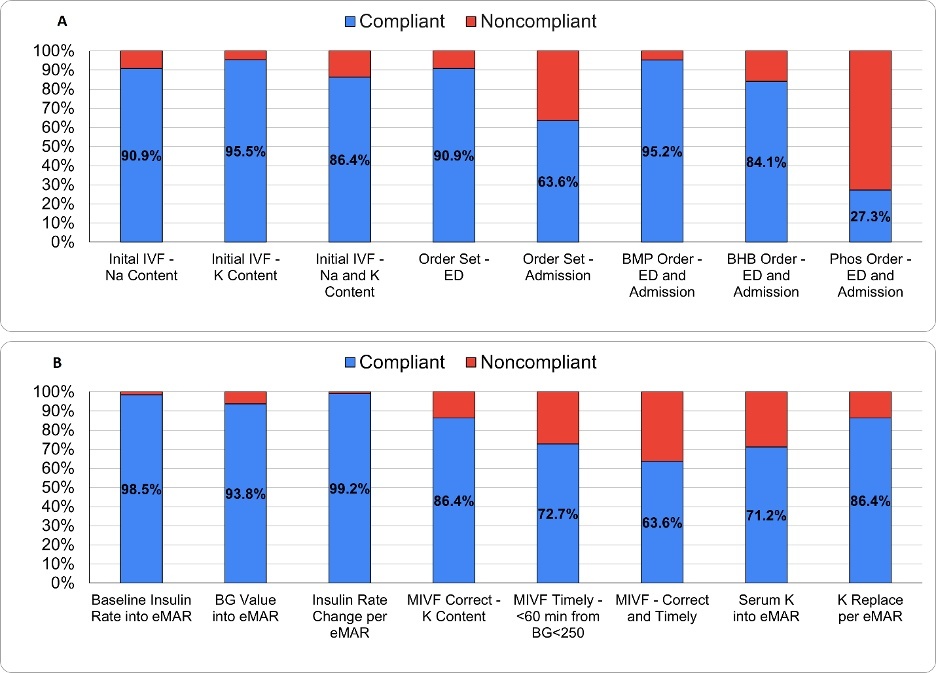
A total of 1029 unique decision points across 22 patients were assessed for protocol adherence (Figure 1). Prescriber compliance was adjudicated across 366 decision points and determined to be 81.7% in total, while nursing compliance included 663 decision points for a total protocol execution accuracy of 87.8%. Aggregate protocol compliance considering all domains was 85.6%.
Discussion
This single-center retrospective analysis adds to current real-world data informing modern health system approaches to DKA management, including the use of a VRII, the concomitant dextrose-containing MIVF rate, and the utility of an ISF-based eMAR calculator to manage VRII titrations. Our primary effectiveness outcome of time to DKA resolution was a median 8.7 hours in this type 1 diabetic population, which appears in line with prior literature. Previous guidelines suggest an expected resolution between six and 24 hours in most patients,1,2 and published reports have found DKA resolution rates of 9.3-28 hours with VRII.8,15,16 Whereas our study utilized time from initiation of dextrose-containing fluids as time zero in assessing DKA resolution, the majority of prior studies use time of DKA diagnosis or time of arrival as time zero, making it difficult to directly compare to prior literature. Although we found no significant difference in DKA resolution time between various dextrose-containing MIVF rates, patients receiving ≥1 mL/kg/hr saw a faster resolution time that warrants further investigation in adequately powered studies.
Published guidance for DKA management is ungraded, suggesting a FRII or other potential strategies based on low-quality evidence.1–3 Our study is among limited reports assessing the effectiveness and safety of a VRII strategy with user-specified dextrose 5% MIVF rate for DKA in Type 1 diabetes. A prior retrospective cohort study compared a two-bag MIVF method using combinations of dextrose 10% and 0.45% saline with concomitant FRII at 0.1 units/kg/hr versus a VRII protocol with concomitant fixed dextrose 5% infusion, finding the FRII “two-bag” protocol was associated with earlier correction of acidosis.17 This study also observed lower rates of hypoglycemia (2.9% vs 10.3%, p= 0.07) and hypokalemia (16.2% vs 27.1%, p = 0.09) with the FRII protocol. Of note, this study used a minimum of 125 mL/hr of dextrose 10% within their two-bag protocol for patients with BG <250 mg/dL. The fixed rates of dextrose 5% used within their one-bag protocol were up to the provider’s discretion and were not reported, leading to difficulty drawing conclusions regarding the efficacy of FRII vs. VRII strategies in DKA.17 However, our study corroborates the high rates of hypoglycemia and hypokalemia seen with a VRII and one-bag dextrose 5% MIVF process.
Two more recent retrospective evaluations of VRII strategies found conflicting results for time to DKA resolution vs. their FRII comparators. However, contrary to our results, hypoglycemia rates were uniformly lower in the VRII groups (13% vs. 50% and 16% vs 23%).15,16 One of these studies noted a hypokalemia rate of 70% with both VRII and FRII approaches, owing to the lack of a protocolized electrolyte replacement strategy in either study group.15 A recent single-arm evaluation of a VRII DKA protocol found an 8.2% hypoglycemia rate and 40.2% incidence of hypokalemia.18 Our protocol therefore appears to be achieving similar rates of DKA resolution and incidences of hypokalemia as compared to prior evaluations of VRII protocols, but prospective data remain lacking to inform the decision of VRII vs. FRII in DKA.
Our study found higher rates of hypoglycemia (32.1%) while on VRII DKA protocol as compared to other published reports assessing VRII approaches (8-16%).8,10,16–18 While we found no statistically significant differences between the dextrose 5% MIVF rate groups, potential trends could be identified with hypoglycemia rates as high as 50% in patients receiving 50 mL/hr. One reason for this could be the use of dextrose 5%, rather than 10%, and at user-specified MIVF infusion rates that are frequently inadequate for a given patient. Protocolizing a minimum dextrose MIVF rate and/or higher concentration could help address this piece. However, our protocol’s eMAR calculator does adjust insulin exposure to very low rates once hyperglycemia is corrected, and these hypoglycemia events may be a function of precipitous BG decline earlier in the course of therapy. While DKA guidelines suggest a BG reduction rate of 54 mg/dL/hr, not to exceed 90-120 mg/dL/hr,1,2 we observed frequent occurrences of BG lowering exceeding 100 mg/dL/hr during VRII therapy (65% of patients). A likely reason for this is the use of a relative, rather than an absolute, BG decrease target in the eMAR calculator logic table (Supplemental Figure 1). Adopting an absolute mg/dL/hr reduction rate logic criterion as seen in other eMAR insulin calculator programs7,9,10,12,13 and/or incorporating a guardrail maximum insulin infusion rate is expected to ameliorate hypoglycemia risk. Alternatively, adopting a two-bag method may be associated with reduced incidence of hypoglycemia during DKA management.19
The assessment of protocol adherence found several points and possible etiologies of noncompliance. While providing separate ED and inpatient DKA order sets allows for tailoring orders to the needs of the ordering providers, we found that providers did not utilize the inpatient order set for 36.4% of patients. The low utilization of the inpatient order set likely led to lower rates of continued orders for BHB, a pre-checked lab on the inpatient order set that is not within the ED order set. Additionally, phosphate levels were only ordered on 27.3% of patients, owing to both the lack of order availability on the ED order set and the order not being pre-checked on the inpatient order set. We also found low rates of nursing adherence to timely conversion to dextrose-containing fluids, which likely contributed to high rates of hypoglycemia. The lower rates of compliance to the potassium eMAR calculator that directs potassium replacement may be explained by the complexity of steps required for correct execution (Supplemental Figure 2).
Our study has important limitations. The single-center, retrospective nature and limited sample size preclude causal determinations, serving purposes limited to process improvement and hypothesis generation. Additional laboratory data and clinical context (eg, baseline acid-base parameters, upstream crystalloid administration) were not captured and could confound the primary and secondary clinical outcomes assessed. The location and level of care (eg, emergency department, intensive versus intermediate care unit) of the patients receiving the institutional DKA protocol could have varied and mediated protocol nonadherence. Additionally, 10% of patients we included were not evaluable for our primary outcome and thus underpowered its analysis. A larger and prospective study may be able to validate an optimal weight-based dextrose MIVF rate in DKA management. While single-center retrospective studies serve to capture real-world outcomes associated with institutional protocols, these must be usurped by adequately powered prospective, randomized controlled trials to make effective comparisons of various insulin-dextrose strategies in DKA.
In conclusion, we observed high rates of hypoglycemia in patients receiving the institutional eMAR-calculated VRII DKA protocol despite appropriate times to DKA resolution, prompting a reappraisal of our current approach. We also observed frequent premature protocol discontinuation before ketoacidosis resolution and suboptimal protocol adherence. Taken together, our findings and prior literature suggest that embedded eMAR calculators are not uniformly associated with optimal insulin protocol effectiveness and safety. We recommend continuous appraisal and optimization of institutional eMAR insulin calculators, and rigorous prospective elucidation of optimal insulin-dextrose management strategies in DKA.
Author Contributions (CRediT taxonomy)
-
Sara J. Hyland, PharmD, BCCCP, FCCP: conceptualization, methodology, investigation, data curation, validation, project administration, supervision, visualization, writing-original draft, writing-review & editing
-
Ha K. Nguyen, PharmD: methodology, investigation, data curation, validation, visualization, writing-original draft, writing-review & editing
-
Mallory S. Faherty, PhD, ATC: methodology, formal analysis, writing-original draft, writing-review & editing
-
Yasmeen M. Hamza, PharmD: investigation, visualization, writing-original draft, writing-review & editing
-
Stephanie M. Seaman, PharmD, BCCCP: conceptualization, methodology, investigation, project administration, visualization, writing-original draft, writing-review & editing
All authors meet ICMJE criteria for authorship and approved the final manuscript.
Acknowledgments
The authors gratefully acknowledge Dr. John Blackman, senior endocrinologist, for his support of this project prior to his well-deserved retirement. Additionally, we thank Marilyn Roper for her instrumental assistance with electronic data extraction from the EHR.
Funding
No external funding was received for this study.
Conflicts of Interest
The authors declare no conflicts of interest related to this work.