

1. Introduction
Alcohol withdrawal syndrome (AWS) is frequently observed in patients who come to the Emergency Department (ED) and often necessitates pharmacologic intervention. Prolonged alcohol use leads to significant neurochemical changes in the brain, notably an upregulation in glutamate receptors such N-methyl-D-aspartate (NMDA), AMPA, and kainate receptors and a downregulation of gamma-aminobutyric acid (GABA) receptors. GABA is the major inhibitory neurotransmitter in the brain, with specific binding sites for ethanol found on the GABA receptor complex. Glutamate, a major excitatory neurotransmitter, binds to receptors causing calcium influx and neuronal excitation. Notably, ethanol inhibits glutamate-induced excitation, and adaptation to chronic alcohol use involves increasing the number of glutamate receptors to maintain normal states of excitation.1
Benzodiazepines and phenobarbital are both used in the management of alcohol withdrawal syndrome, but they have distinct characteristics. Phenobarbital exhibits a more predictable response compared to benzodiazepines, and some patients unresponsive to benzodiazepines find successful treatment with barbiturates due to differences in their mechanisms and drug targets. Benzodiazepines work on the GABA-A receptor and require the presence of endogenous GABA to facilitate channel opening. In contrast, phenobarbital acts on a different site on the GABA receptor and does not rely on endogenous GABA, thereby prolonging channel opening. Phenobarbital also inhibits glutamate receptors, specifically AMPA and kainate receptors, which are involved in seizures and withdrawal symptoms if overactive.2 Thus, phenobarbital affects both pathways implicated in alcohol withdrawal, whereas benzodiazepines affect only one. Additionally, the long half-life of phenobarbital enhances its efficacy by prolonging the duration of action. These factors have led to the resurgence of phenobarbital as a prominent treatment option for AWS.
Despite current guidelines favoring benzodiazepines due to their safety and effectiveness in preventing seizures and delirium, there is increasing use of phenobarbital for severe alcohol withdrawal syndrome (AWS).3 Studies have demonstrated the effectiveness and safety of phenobarbital in treating severe alcohol withdrawal syndrome (AWS), with outcomes comparable to benzodiazepines. Furthermore, studies that explored the use of a phenobarbital loading dose in treating AWS have demonstrated significant differences in outcomes when compared to patients not receiving loading dose. Rosenson et al. (2013) demonstrated decreased ICU admissions and comparable adverse effects when a 10mg/kg loading dose of phenobarbital was added to benzodiazepines.4 More recently, Malone et al. (2023) reported reduced length of stay and respiratory complications with phenobarbital loading doses (either 6 mg/kg or 10 mg/kg) in conjunction with an oral tapered phenobarbital protocol compared to benzodiazepine treatment.5 However, most prior studies have been conducted under controlled or highly protocolized conditions. There is limited evidence evaluating high-dose phenobarbital in real-world clinical practice where dosing is more flexible.
Study Objective
The primary objective of this study is to evaluate whether a high dose (≥7.5 mg/kg) of intravenous phenobarbital for the treatment of severe alcohol withdrawal affects ICU admission rates compared to standard treatment.
2. Methods
2.1. Study Design and Setting
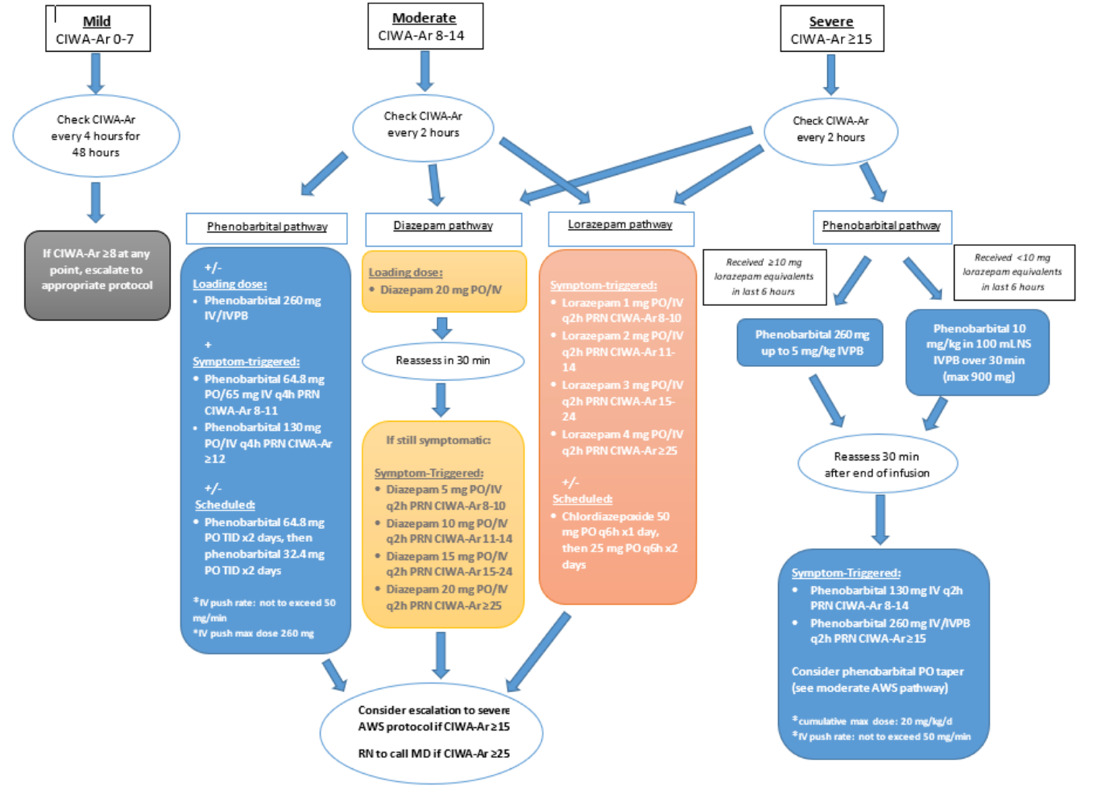
This Institutional Review Board (IRB) approved retrospective single-center medical record review examined patients with severe alcohol withdrawal in the ED of Riverside University Health System (RUHS), a 439-bed community teaching hospital with a protocolized alcohol withdrawal pathway, from February 2022 to August 2023. A new alcohol withdrawal orderset that included pathways for benzodiazepines and phenobarbital was initiated at this institution in January of 2022 (Figure 1). According to the institutional pathway, patients with CIWA-Ar ≥15 were categorized as severe AWS and recommended to receive the phenobarbital pathway. Patients with moderate AWS (CIWA-Ar 8–14) could initially be managed with phenobarbital, diazepam, or lorazepam, with escalation to the severe pathway if CIWA-Ar scores increased ≥15. (Figure 1).
Patients were identified using electronically generated reports of adult patients with an alcohol withdrawal diagnosis defined by ICD-10 codes (F10.239, F10.230, F10.231, F10.232, F10.932) and a CIWA-Ar score >15 within 12 hours of emergency department presentation. The CIWA-Ar scores were documented by nursing staff in the patient charts.
Inclusion criteria included adults aged 18 years and older diagnosed with alcohol withdrawal per ICD-10 codes and a CIWA-Ar (Clinical Institute Withdrawal Assessment for Alcohol, Revised) score of at least 15 within 12 hours of ED presentation. Patients must have received at least one dose of benzodiazepines or phenobarbital.
Exclusion criteria included pregnancy, allergy to phenobarbital or lorazepam, use of phenobarbital or benzodiazepines as scheduled home medication, phenobarbital >260 mg and lorazepam >10 mg within the first 6 hours of CIWA ≥15, severe hepatic impairment, alternate etiology for delirium, and prisoners.
The high-dose (HD) phenobarbital group was defined as patients who received ≥7.5 mg/kg phenobarbital (cumulative within the initial treatment period), with or without benzodiazepines, provided benzodiazepine exposure did not exceed exclusion thresholds. The non–high-dose group included patients who received phenobarbital <7.5 mg/kg, benzodiazepines alone, or phenobarbital in combination with benzodiazepines below the exclusion threshold. Phenobarbital could be administered as IV push (≤260 mg, not to exceed 50 mg/min), orally (≤130 mg), IVPB over 30 minutes (for 10 mg/kg loading), or as IV boluses/infusion cumulatively reaching ≥7.5 mg/kg. Patients were reassessed using repeat CIWA-Ar scoring every 2 hours following medication administration, or 30 minutes after completion of a phenobarbital loading infusion.
The primary outcome was ICU admission rate. Secondary outcomes included ICU length of stay, hospital admission rate, rate of mechanical ventilation, duration of mechanical ventilation, 7-day readmission rate, hospital mortality, total benzodiazepine dose in lorazepam equivalents (1mg lorazepam = 10 mg of chlordiazepoxide = 5 mg of diazepam), use of adjunctive medication for symptom management and discharge against medical advice rate. Adjunctive therapies outside of phenobarbital and benzodiazepines were not systematically characterized by agent or dose; however, the use of adjunctive therapy, defined as dexmedetomidine, propofol, ketamine, haloperidol, quetiapine, olanzapine, clonidine, or gabapentin, was captured and recorded collectively as a binary variable (received vs. not received).
2.2. Statistical Analysis
A power analysis was not performed since the study is retrospective. Continuous variables were described using the median and interquartile range with comparisons performed using the Mann-Whitney U test (Tables 1 and 2). Categorical variables were described using counts and proportions, with comparisons performed using Pearson’s Chi-square test of independence (Table 2 and Figure 3).
Data on hospital admission rate, ICU admission rate, rate of mechanical ventilation, 7-day readmission rate, use of adjunctive medication for symptom management and discharge against medical advice rate were analyzed by multivariate logistic regression (Table 3).
The multivariable logistic regression model for each of the above categorical outcomes were composed with high-dose phenobarbital cases as the treatment group and the non-high-dose phenobarbital cases as the control group while adjusting for patient’s age (years), weight (kg) and CIWA-Ar to estimate the true effect of high-dose phenobarbital.
Meanwhile, data on phenobarbital dose (6 hours), phenobarbital dose (total), ICU LOS (hours), CIWA-Ar (0-67), ED LOS (hours), total hospital LOS (hours), duration of mechanical ventilation (hours), day of readmission (0-7), and benzodiazepine dose (0-48) were analyzed by analysis of covariance (ANCOVA) (Table 4).
Specifically, the ANCOVA model for the continuous outcomes were composed with high-dose phenobarbital cases as the treatment group and the non-high-dose phenobarbital cases as the control group while adjusting for patient’s age (years), weight (kg) and CIWA-Ar to estimate the true effect of high-dose phenobarbital.
3. Results
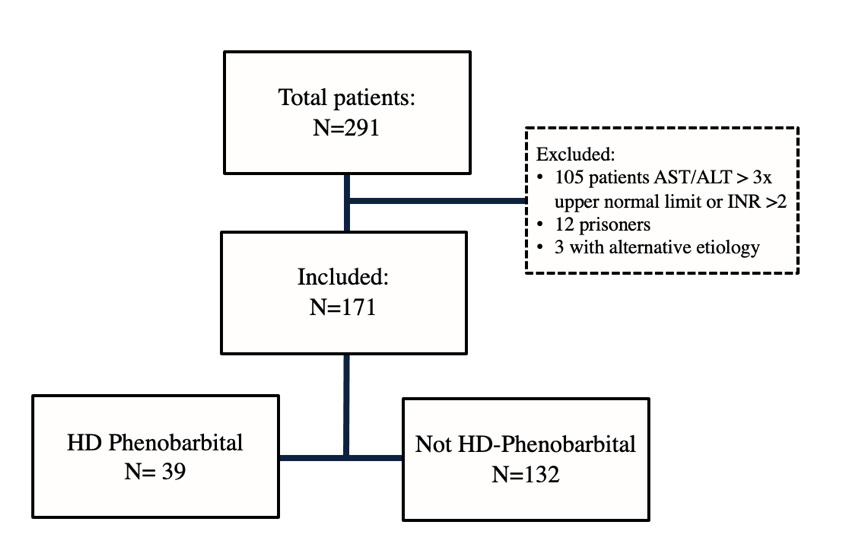
During the study period, 291 patients presented to the ED with severe alcohol withdrawal, and 120 patients were excluded. Reasons for exclusion included AST/ALT greater than three times the upper normal limit or INR greater than 2, prisoner status, and alternate etiology for delirium. There were 171 remaining patients, with 39 in the high-dose phenobarbital group and 132 in the non-high-dose group, respectively (Figure 2). Median CIWA-Ar score (23 vs 19) was significantly higher in the high-dose phenobarbital group (p <0.001) (Table 1). There were no other statistically significant differences between the high-dose phenobarbital and the non-high-dose phenobarbital group in baseline characteristics including age and weight.
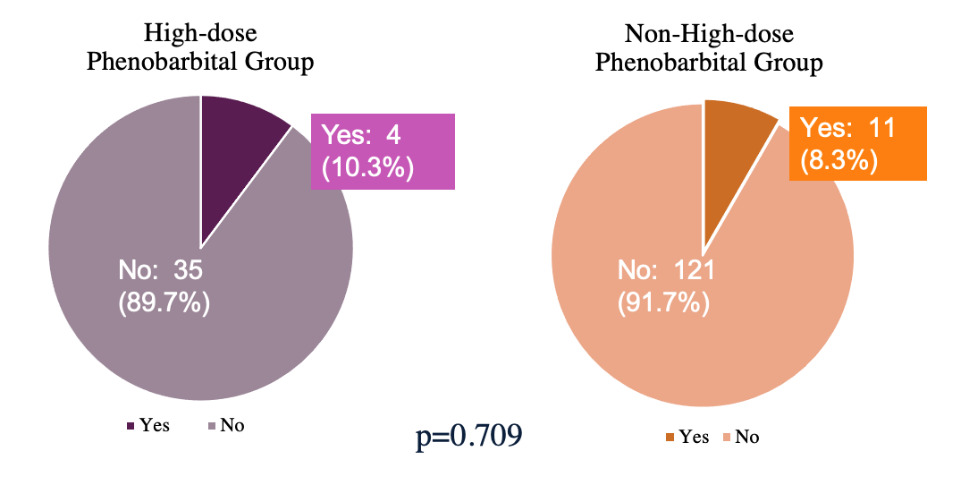
There was no statistically significant difference in the primary outcome of ICU admissions. There were 4 patients (10.3%) in the high-dose group and 11 (8.3%) patients in the non-high-dose group that were admitted to the ICU (p= 0.749) (Figure 3).
.png)
For the secondary outcomes, there was a significant difference between ICU length of stay (LOS) showing shorter LOS in the high-dose phenobarbital group (24 hours (IQR: 17-38) versus 63 hours (IQR: 49-95); p =0.006). There was also a significant difference in hospital admissions with more patients in the high-dose group being admitted (38 [97.4%] versus 109 [82.6%], p= 0.019). Total benzodiazepine dose was significantly less in the high-dose group (2 mg (IQR: 1-8) versus 8 mg ((IQR: 1-21); p= 0.007). The median dose of phenobarbital patients received within 6 hours of first CIWA-Ar greater than 15 was 953mg or 12.4 mg/kg (IQR: 700-1160) in the high-dose phenobarbital group, and the total dose of phenobarbital patients in this group received during the entire admission was 1409 mg or 18.3 mg/kg. There were no significant differences in ED length of stay, total hospital length of stay, mechanical ventilation, readmission rate, adjunctive medication use, and discharge against medical advice rate. A full summary of clinical outcomes is provided in Table 2.
After adjusting for patient age, weight, and baseline CIWA-Ar, no significant differences were observed between the high-dose and non–high-dose phenobarbital groups across the categorical outcomes of rates of hospital admission, ICU admission, mechanical ventilation, 7-day readmission, use of adjunctive medications, and discharge against medical advice (Table 3).
After adjusting for patient age, weight, and baseline CIWA-Ar, the high-dose phenobarbital group differed significantly from the non–high-dose group across several outcomes (Table 4). High-dose phenobarbital was associated with greater cumulative phenobarbital exposure (6-hour and total dose). Conversely, high-dose phenobarbital was also associated with shorter ICU length of stay and lower benzodiazepine requirements.
No significant differences were observed between the high-dose and non–high-dose phenobarbital groups in emergency department length of stay, total hospital length of stay, duration of mechanical ventilation, and readmission intervals. (Table 4).
4. Discussion
This data showed no significant difference in ICU admission rates between patients treated with high-dose phenobarbital and those who were not. This is particularly noteworthy given that the patients in the high-dose phenobarbital group presented with a significantly higher CIWA-Ar score at baseline, indicating a more severe state of withdrawal upon presentation. While this imbalance may represent confounding by baseline severity, it also raises the possibility that high-dose phenobarbital may mitigate the risk of ICU transfer in sicker patients. The lack of a significant difference in ICU admissions despite greater initial severity suggests that high-dose phenobarbital may effectively manage severe AWS symptoms to a degree comparable with other treatment modalities, even in more critically ill patients. When adjusting for weight, age, and baseline CIWA-Ar score, no significant differences were observed between the high-dose and non– high-dose phenobarbital groups on ICU admission.
ICU admission was selected as the primary outcome to align with Rosenson et al. who reported a significant reduction in ICU admissions with the addition of a single 10 mg/kg adjunctive dose of phenobarbital to standard benzodiazepine therapy (8% vs. 25%, 95% CI 4–32).4 In contrast, this study did not replicate this finding. Several factors may explain the differing results. First, the Rosenson et al. study was prospective and randomized, allowing for standardized treatment and reduced confounding, whereas our study was retrospective and observational, relying on chart review and clinician-driven dosing decisions. This introduces greater potential for bias from unmeasured confounders such as provider practice variation and undocumented clinical factors. Second, their intervention involved a standardized single adjunctive dose, while our high-dose phenobarbital group reflected real-world practice with variable cumulative dosing strategies, sometimes exceeding the anticipated threshold. Finally, patients in this cohort had higher baseline CIWA-Ar scores, indicating greater severity at presentation, which may have influenced ICU admission rates independent of treatment strategy. These differences underscore the challenges of directly comparing trial data with real-world practice and highlight the need for additional prospective studies.
One of the most clinically meaningful findings from this study is the reduction in ICU length of stay for the HD-phenobarbital group. Despite presenting with more severe withdrawal symptoms initially, these patients had shorter ICU stays compared to those not receiving high-dose phenobarbital, even after adjusting for baseline characteristics. This suggests that high-dose phenobarbital may accelerate the stabilization process in severe AWS, thereby reducing the burden on ICU resources and potentially improving patient outcomes. This finding aligns with Malone et al., who reported reduced ICU LOS (2 vs. 4 days, respectively) and hospital LOS, though this study did not observe a difference in overall hospital length of stay.5
Hospital admission rate was observed to be greater in the high-dose phenobarbital group. When adjusting for baseline characteristics, there was no significant difference between groups. This suggests that the greater hospital admission rate is likely attributable to the greater severity of withdrawal symptoms at baseline presentation.
While this study provides valuable insights into the use of high-dose phenobarbital for managing severe AWS, several limitations must be considered when interpreting the results. One of the primary limitations is the retrospective design of the study. Retrospective studies are inherently limited by their reliance on previously collected data, which can introduce various biases and confounding factors. In this study, the data were drawn from medical records, which might lack uniformity in documentation practices and completeness. Further, the medication selection, dosage, and timing of medication administration were subject to individual provider preference and nurse monitoring. This variability can lead to inconsistencies in treatment, affecting the reliability of the results. Different providers may have varying thresholds for initiating treatment, choosing dosages, and monitoring patient responses, which can introduce significant heterogeneity into the studied treatment arms. These authors also note that reliance on CIWA-Ar scoring to define alcohol withdrawal severity may introduce misclassification bias. CIWA-Ar scoring may vary with provider interpretation and other patient-specific factors, such as comorbidities, which may have affected group assignment and outcome comparisons; however, CIWA-Ar scoring remains the standard for categorizing AWS severity. Furthermore, the single-center study design may limit generalizability to other institutions with different clinical practices or patient populations.
Finally, another significant limitation was the inability to isolate the effects of phenobarbital versus lorazepam due to their overlapping use in the patient population. Both HD and non-HD groups could receive benzodiazepines per CIWA-Ar–driven protocol, provided they did not exceed exclusion thresholds. The heterogeneity of the non-HD group (phenobarbital-only, benzodiazepine-only, or phenobarbital plus benzodiazepines) is acknowledged as a study limitation. Concurrent benzodiazepine use may have confounded outcomes, although this reflects real-world practice.
To minimize confounding, exclusion thresholds for both phenobarbital (>260 mg in 6 hours) and lorazepam (>10 mg in 6 hours) were applied to reduce confounding from patients who received high doses of both agents. It is noted that this exclusion criteria may limit generalizability of results for patients experiencing extremely severe withdrawal symptoms necessitating this aggressive treatment. Additionally, reassessment protocols (CIWA-Ar every 2 hours or 30 minutes after a phenobarbital loading infusion) were applied to try to standardize evaluation of treatment response. Despite these safeguards, residual confounding remains possible, and findings should be interpreted in this context.
This study defined high-dose phenobarbital as ≥7.5 mg/kg, which was chosen to capture patients who received cumulative “pulse” dosing of phenobarbital in addition to those who received a single full loading dose. At the time of this study, the institutional protocol was newly implemented, and provider practice often varied between giving a structured load and administering sequential boluses that accumulated to a comparable dose. The 7.5 mg/kg threshold was also selected because it lies between the dosing strategies described by Rosenson et al. (10 mg/kg adjunctive dose) and Malone et al. (structured 6 or 10 mg/kg load), thereby providing a clinically meaningful cutoff for high-dose exposure in real-world practice. The observed median dose in this group was 12.4 mg/kg, which is higher than anticipated. This discrepancy limits the generalizability of our findings to patients receiving more modest doses near the cutoff, complicates comparisons to prior studies using different thresholds, and may bias outcomes toward reflecting effects of higher phenobarbital exposures.
Adverse events were not systematically collected beyond mechanical ventilation and mortality, which limits the strength of our safety conclusions. It is important to acknowledge the controversies and risks associated with phenobarbital use, including its narrow therapeutic index, potential for respiratory depression, oversedation, hypotension, and the absence of a reversal agent. Nonetheless, no excess harm was observed with HD phenobarbital in this study’s cohort.
This study highlights several important areas for future research. Building on these findings, future work should directly compare outcomes in patients receiving HD- phenobarbital versus those managed with alternative strategies, with particular attention to clinically meaningful endpoints such as need for mechanical ventilation, respiratory complications, and benzodiazepine-sparing effects. Prospective or pre/post protocol implementation studies would be ideally suited to address these questions. Such studies could provide more definitive evidence on the efficacy and safety of this treatment approach. This study can also serve to provide education to providers about the safety and efficacy of high doses of phenobarbital for AWS.
5. Conclusion
This study supports the overall safety and effectiveness of high-dose phenobarbital in managing severe AWS, demonstrating potential for improved clinical outcomes compared to standard treatments.
Funding
This research did not receive any specific grant from funding agencies in the public, commercial, or not-for-profit sectors.
Conflicts of Interest
The authors declare that there is no conflict of interest regarding the publication of this article.
IRB APPROVAL
IRB obtained at local institution